"Dev X used 2k tokens with Opus" is not telemetry
“Dev X used 2k tokens with Opus.” That’s the kind of number you get out of the box, and it’s fine for a bill. It’s useless for deciding anything.
What I actually wanted to know, after rolling Claude Code and GitHub Copilot out to a team with a shared set of plugins, skills and agents: which of those get used, and by how many people? How many people have a plugin installed but never touch it? What does a repository cost us? Is the thing we distributed used at all, or did we just make ourselves feel better?
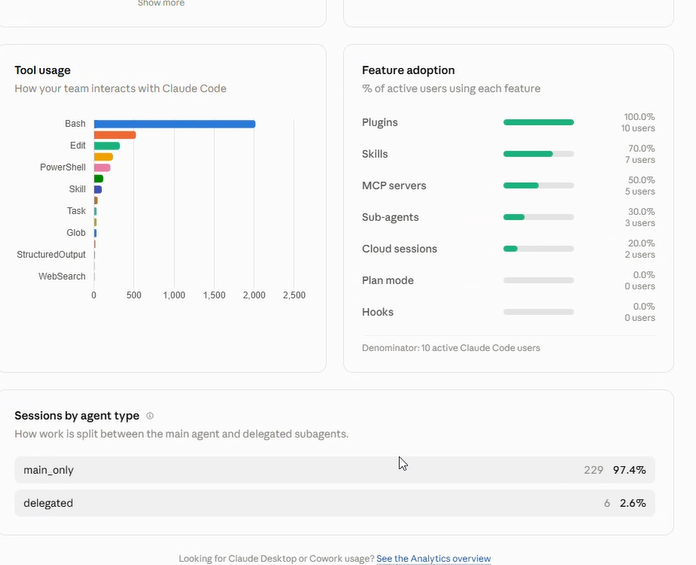
Claude Code’s built-in analytics gets you part of the way. It tells you that 10 of your users used plugins, but not which plugin:
My first attempt at the rest was a hook that posts events to Application Insights myself. It worked. Then I realized I’d own it forever: the schema, the auth, every harness update that renames an event.
Then I found out both tools already emit OpenTelemetry. A setup that works out of the box beats one I maintain, so I threw the hook away.
This post has been a long time coming. I kept wrangling with what Claude Code, the Copilot CLI and VS Code each emit, and VS Code was painfully different from the other two. With the switch to the new Copilot harness that’s finally over: VS Code and the CLI emit the same signals, so one setup covers both.
Below is what the setup looks like, what to collect and what to leave out, what you get to look at, and how to roll it out to every machine. The collector configs, managed settings, queries and dashboards for Claude Code, Copilot and both together are in a sample repo.
OTEL in two minutes
OpenTelemetry has three signal types: metrics (numbers over time), events, which it calls logs, and traces (one span per operation, nested). That’s all you need. Claude Code sends metrics and events. Copilot sends traces and metrics.
You could point both straight at Application Insights, but it wants an Entra token per developer, not a header you can put in a settings file. So there’s a small collector in the middle:
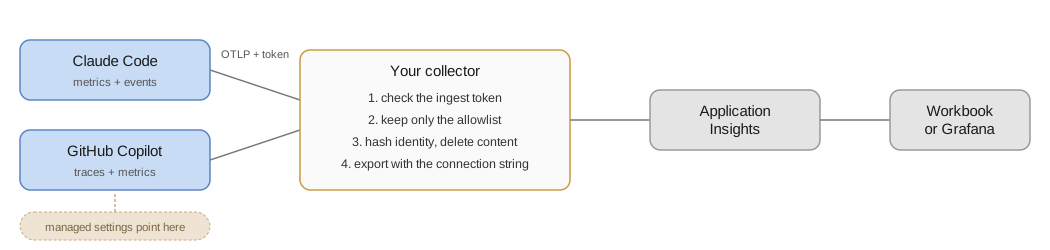
The collector accepts a bearer ingest token, then filters, transforms and exports with the connection string. To be honest about that token: every client that receives the managed settings can see it. It only stops outsiders. I checked against the hosted collector: no token gets a 401, a wrong token gets a 401, the right one gets a 200.
Hosting it is small. One Container App, one container, one YAML file mounted from a secret, pinned to one replica. The ingest token, the salt and the connection string are secrets. One gotcha: changing only a secret doesn’t create a new revision, so restart it. The sample repo has the details, I won’t write a walkthrough here.
Here’s a trimmed version of the config, with one receiver, one filter, one transform and one exporter:
receivers:
  otlp:
    protocols:
      http:
        endpoint: 0.0.0.0:4318
        auth:
          authenticator: bearertokenauth/ingest

processors:
  filter/allowlist:
    logs:
      log_record:
        - >-
          not (attributes["event.name"] == "skill_activated"
          or attributes["event.name"] == "plugin_loaded"
          or attributes["event.name"] == "subagent_completed")

  transform/pseudonymize:
    log_statements:
      - context: log
        statements:
          - set(log.attributes["user.pseudo_id"], Substring(SHA256(Concat(["${env:PSEUDONYM_SALT}", log.attributes["user.email"]], ":")), 0, 16)) where log.attributes["user.email"] != nil
          - delete_key(log.attributes, "user.email")

exporters:
  azure_monitor:
    connection_string: ${env:APPLICATIONINSIGHTS_CONNECTION_STRING}
Why Application Insights? It was already there, it speaks KQL, and workspace access control comes with it.
Start from the questions, not the signals
The harnesses emit a long list of things: skill_activated, subagent_completed, plugin_loaded, mcp_server_connection, tool_result, cost. You could spend a week deciding which ones matter. The list doesn’t matter, the questions do. Mine:
- What adds value and what doesn’t? Which skills, agents and plugins are used, and by how many people. Which are loaded but never used.
- Where should we put effort? How many people have a plugin but don’t use it. A plugin everyone loads and nobody touches needs a better description or a demo.
- What does it cost? Per repository, per model, and which sessions ran away.
- Is the rollout healthy? MCP servers failing to connect, client version drift.
The “8 of 10 people use the plugin” question is one KQL query: for each plugin, how many users and sessions loaded it, and how many skill uses came out of it.
let loaded = traces
| where timestamp > ago(30d) and message == "claude_code.plugin_loaded"
| summarize loaded_users = dcount(tostring(customDimensions["user.pseudo_id"])),
            loaded_sessions = dcount(tostring(customDimensions["session.id"]))
  by plugin = tostring(customDimensions["plugin.name"]);
let used = traces
| where timestamp > ago(30d) and message == "claude_code.skill_activated"
    and tostring(customDimensions["skill.source"]) == "plugin"
| summarize skill_uses = count()
  by plugin = tostring(customDimensions["plugin.name"]);
loaded
| join kind=leftouter used on plugin
| project plugin, loaded_users, loaded_sessions, skill_uses = coalesce(skill_uses, 0)
A plugin at the top with lots of sessions and zero skill uses is one people have but don’t use.
One caveat on cost: Claude Code’s cost figure is a client-side estimate in dollars, not a bill. Copilot reports AI credits on its spans instead, and on the CLI runs I compared they matched what the CLI printed. I haven’t compared either against actual billing.
Collect the minimum, and delete the rest before it’s stored
The harnesses can emit a lot more than counts: prompts, responses, tool inputs, the user’s email. Claude Code will let you track a user down to every single prompt they type. Try doing that in the EU and GDPR will likely strangle you. And I didn’t want it anyway. I wanted counts and names.
One thing to know about the Claude Code side: to see plugin, skill and agent names you have to turn on OTEL_LOG_TOOL_DETAILS, and that also sends tool inputs: MCP queries, bash commands. Without it, every non-official plugin, skill and agent collapses to third-party or custom, which makes the dashboard pointless. So the collector has to be yours, over HTTPS, and it has to delete the content before anything is stored. I tested it by putting marker strings in an MCP query and a bash command. They showed up nowhere in the output.
Two rules:
Allowlist. The collector keeps only the events and metrics the questions need. Prompts and responses are off at the client. Lines of code, commits, PRs, tool approvals and API errors are dropped. Lines of code and the like are pointless KPIs, and I don’t want anyone mistaking the dashboard for a productivity score.
Hash the identity you can read, restrict the identity you can’t. Claude Code sends the email, so the collector replaces it with a salted hash. The salt lives only on the collector, never in managed settings. Copilot’s enduser.pseudo.id is already opaque, so I pass it through and let workspace access protect it. Same person, same id, so the counts still work without names.
Pseudonymous is still personal data. Restrict access to the workspace, and say out loud what it’s for. I’d rather someone read my browser history than my prompt history.
What you actually look at
You have options. Azure Workbooks need nothing extra to host. Azure Managed Grafana is the tool you can take elsewhere. Power BI suits scheduled management reports. I tried Grafana first, and it looks nice:
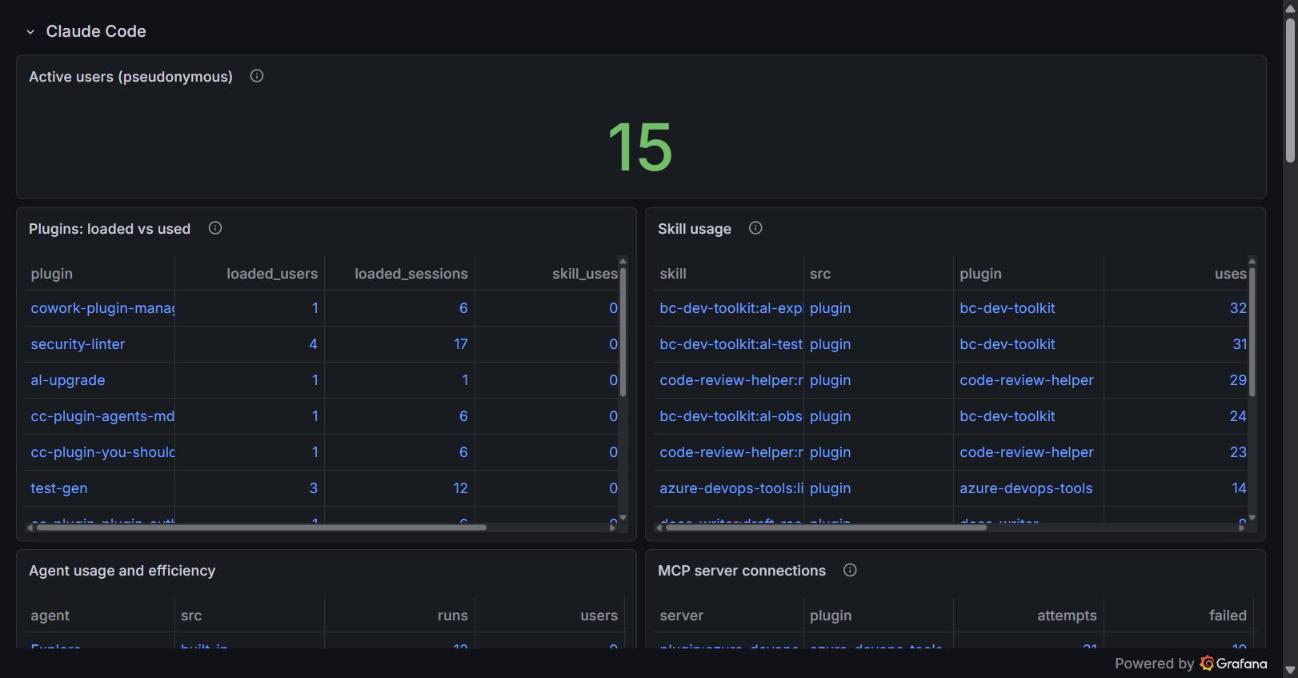
Then I went with Workbooks. They run the same KQL, use the same Azure access control, and there’s no extra service to run. The sample repo has both versions.
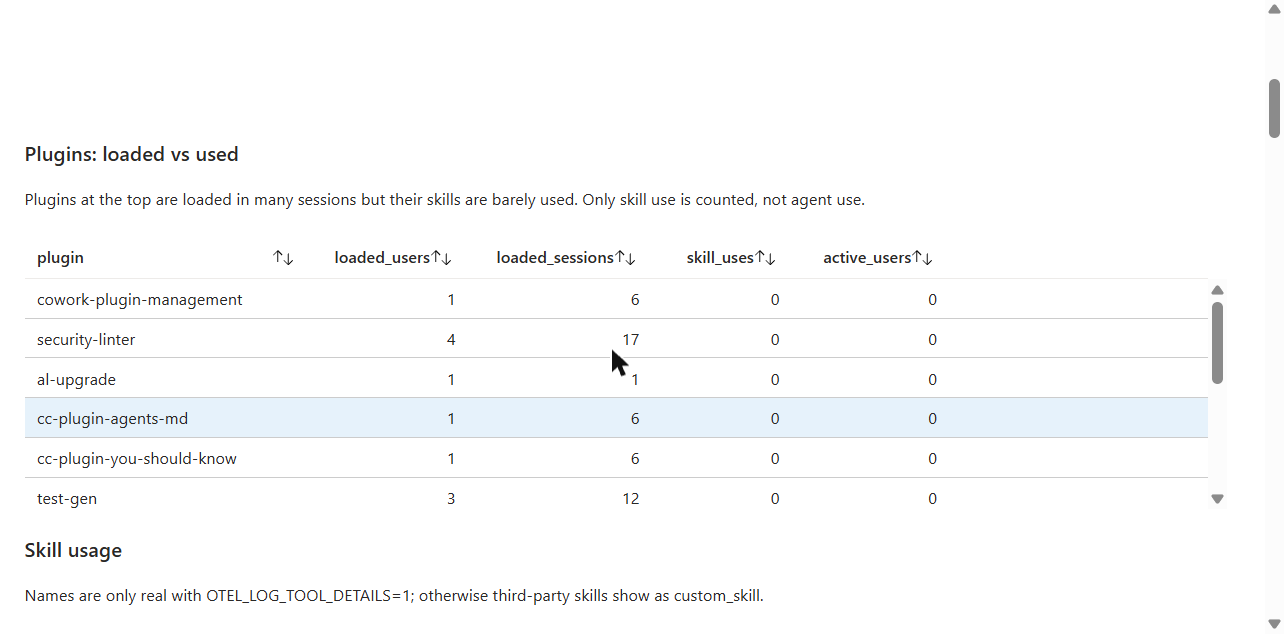
Community dashboards exist for both tools, but they expose far too much. Once there are that many data points you stop looking at any of them, which is why I wrote my own queries. The first version of mine had 53 panels and had the same problem. The core dashboard now has nine: active users, plugins loaded vs used, skills, subagents, MCP connections, MCP tool usage, tool usage by name, cost by repository, and a check that no content got stored, which must read 0.
Department comes from the repository. The email is hashed, so I map repository to department with a small lookup table.
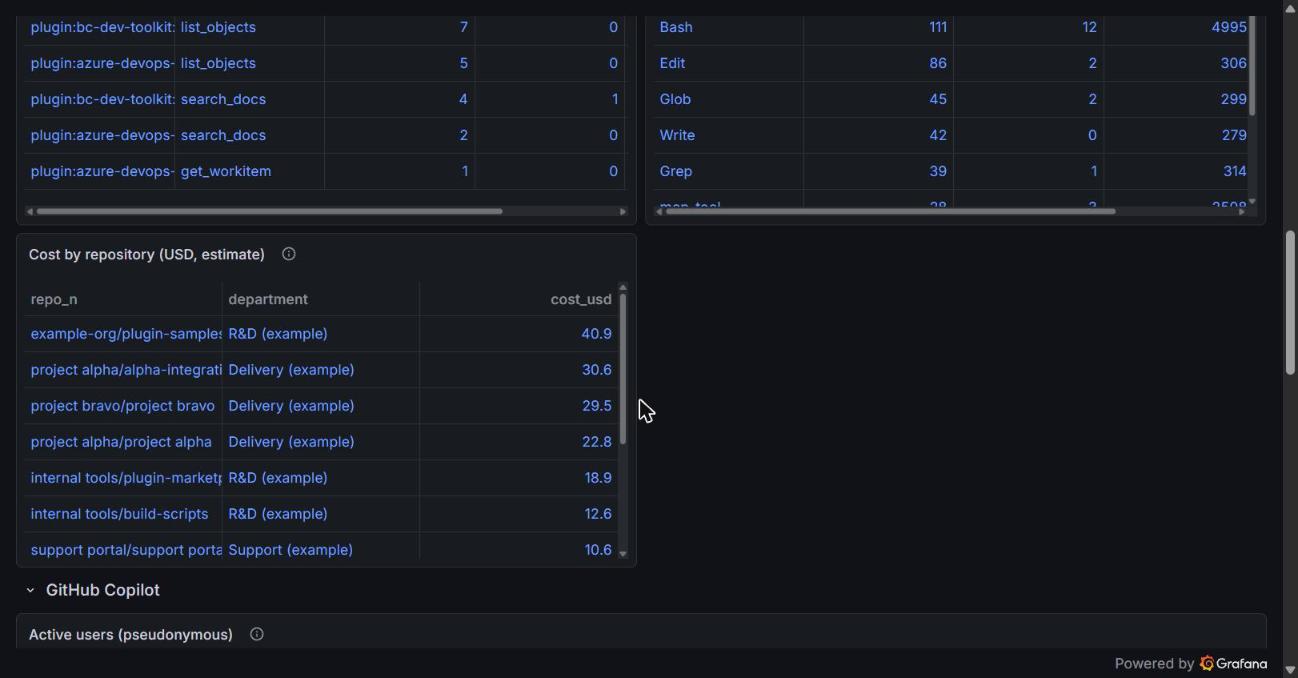
(The repositories and departments in these screenshots are example data.)
One thing the dashboard can’t tell you: which skills are never used. Telemetry only reports what happened. To see the gaps you need a catalog of what each plugin ships, to compare against.
Getting it onto every machine
Managed settings are the way, for a simple reason: they win over local settings, so developers can’t switch telemetry off, and you don’t need device management.
For Claude Code that’s the Managed settings entry in the admin console, where I set it up.
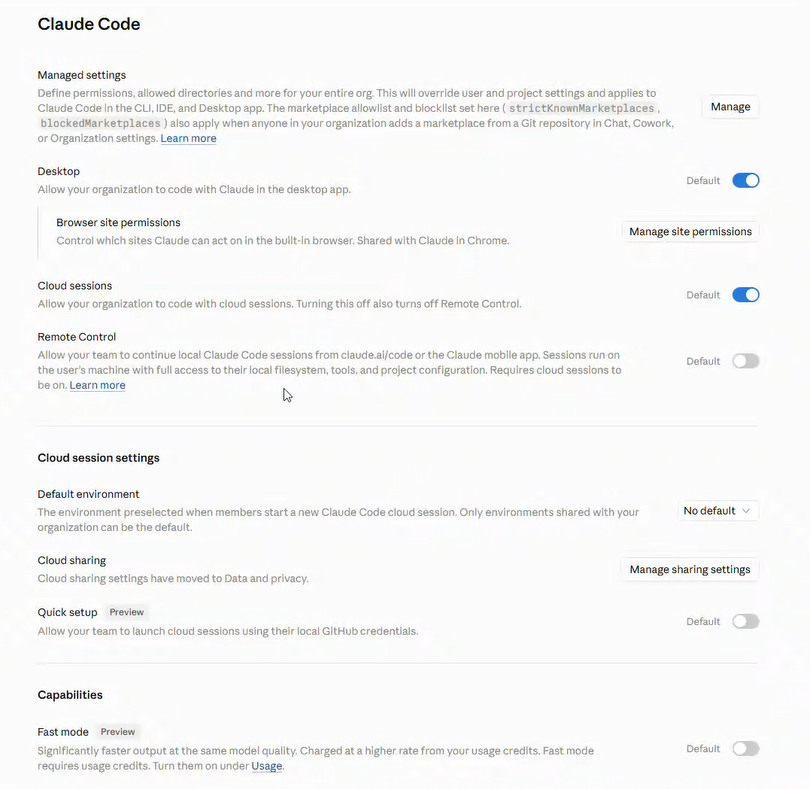
It’s mostly an env block, token redacted here, plus the known marketplace (more on that below):
{
  "extraKnownMarketplaces": {
    "sample-marketplace": {
      "source": {
        "source": "git",
        "url": "https://github.com/tinestaric/plugin-marketplace-sample.git"
      },
      "autoUpdate": true
    }
  },
  "env": {
    "CLAUDE_CODE_ENABLE_TELEMETRY": "1",
    "OTEL_METRICS_EXPORTER": "otlp",
    "OTEL_LOGS_EXPORTER": "otlp",
    "OTEL_EXPORTER_OTLP_PROTOCOL": "http/protobuf",
    "OTEL_EXPORTER_OTLP_ENDPOINT": "https://<your-collector>",
    "OTEL_EXPORTER_OTLP_HEADERS": "Authorization=Bearer <ingest-token>",
    "OTEL_EXPORTER_OTLP_METRICS_TEMPORALITY_PREFERENCE": "delta",
    "OTEL_METRICS_INCLUDE_REPOSITORY": "true",
    "OTEL_LOG_USER_PROMPTS": "0",
    "OTEL_LOG_ASSISTANT_RESPONSES": "0",
    "OTEL_LOG_TOOL_DETAILS": "1",
    "OTEL_LOG_TOOL_CONTENT": "0",
    "OTEL_LOG_RAW_API_BODIES": "0"
  }
}
The only other managed setting I’d use is the known marketplace (extraKnownMarketplaces), so the shared plugin set is there without anyone adding it by hand. In the sample it points at the repo from the plugins post, swap in your own. Permissions, MCP and plugin allow/deny lists, forced hooks, minimum version: all available, and I’d skip them for this.
Copilot has the same idea under a different name: enterprise managed settings, with a telemetry block that covers VS Code and the agent host behind the CLI. A managed value beats environment variables and user settings. I’ve only set up the Claude Code side so far, so everything below is from GitHub’s docs.
{
  "extraKnownMarketplaces": {
    "sample-marketplace": {
      "source": {
        "source": "github",
        "repo": "tinestaric/plugin-marketplace-sample"
      },
      "autoUpdate": true
    }
  },
  "telemetry": {
    "enabled": true,
    "endpoint": "https://<your-collector>",
    "protocol": "http/protobuf",
    "captureContent": false,
    "lockCaptureContent": true,
    "serviceName": "github-copilot"
  }
}
The known marketplace works here too, with the same key. It also accepts a github source (OWNER/REPO), which is shorter than the git URL.
To set it up, you pick an organization in your enterprise to host the config (in the AI Controls tab of the enterprise settings, or through the API), create the file copilot/managed-settings.json in that organization’s .github-private repository, and commit it to the default branch. The Agents page under AI controls shows whether it’s active. Clients fetch it when the user signs in and refresh it hourly. The same settings can also be pushed through MDM. We didn’t take that route, because it means a fight with the IT department.
There are two caveats:
- It follows the account. The server-managed route applies to users with a Copilot Business or Copilot Enterprise seat issued from your enterprise or one of its organizations. A developer signed in with a personal account, or a seat from somewhere else, doesn’t get your settings. I couldn’t find what happens then in the docs, so test that case before you trust the numbers.
- You need somewhere to host the file. If you only use GitHub to hand out Copilot Business seats and have no organizations, you need one user with a GitHub Enterprise license to create an organization and the
.github-privaterepo. The MDM route needs none of that.
One more thing if you set telemetry locally in VS Code instead: the agent harness reads chat.agentHost.otel.*, and enabled defaults to false. Reload the window after changing it.
Where this leaves things
A small allowlist, content deleted and identity hashed in a collector you control, managed settings to ship the config, one minimal dashboard, and a re-check after every harness update.
Don’t start with every signal. Write down five questions you’d actually act on, and collect only what answers them. The sample repo has the collector, settings, queries and dashboards to start from.