100 Areopa Webinars Visualized
Areopa Webinars just hit number 100! And I used this milestone as another visualization side-project. :P
If you don’t know Areopa, the short description of it is a YouTube channel of BC-related webinars that have been going strong most Mondays since 2019! Luc van Vugt leads it, but the whole community contributed to the content! Luc, if you’re reading this, you really do deserve a shoutout… You didn’t only create this huge (and still growing) collection of BC knowledge, but you’ve also setup a platform where anyone can come and share what they know with everyone!
Here’s why I care so much about Areopa. I’ve been very lucky to be in a position, where I get to travel to multiple conferences every year, and I listen to so many amazing sessions. It’s easy to stay “up to date” when I hear about best practices all the time, directly from the industry’s best. But not everyone gets that chance. And here’s where Areopa really excels, it brings that same level of high-quality sessions to everyone! For free! Forever! Conference sessions are great, but we forget most of what we hear the very next day. Areopa makes it available forever. You can always get back to a certain topic once it’s relevant to you again.
I didn’t want to just give praise to Areopa though. As I mentioned at the beginning, I used this opportunity as another visualization side project. Back in November, after Ignite, I came across this visualization by Nitya Narasimhan.
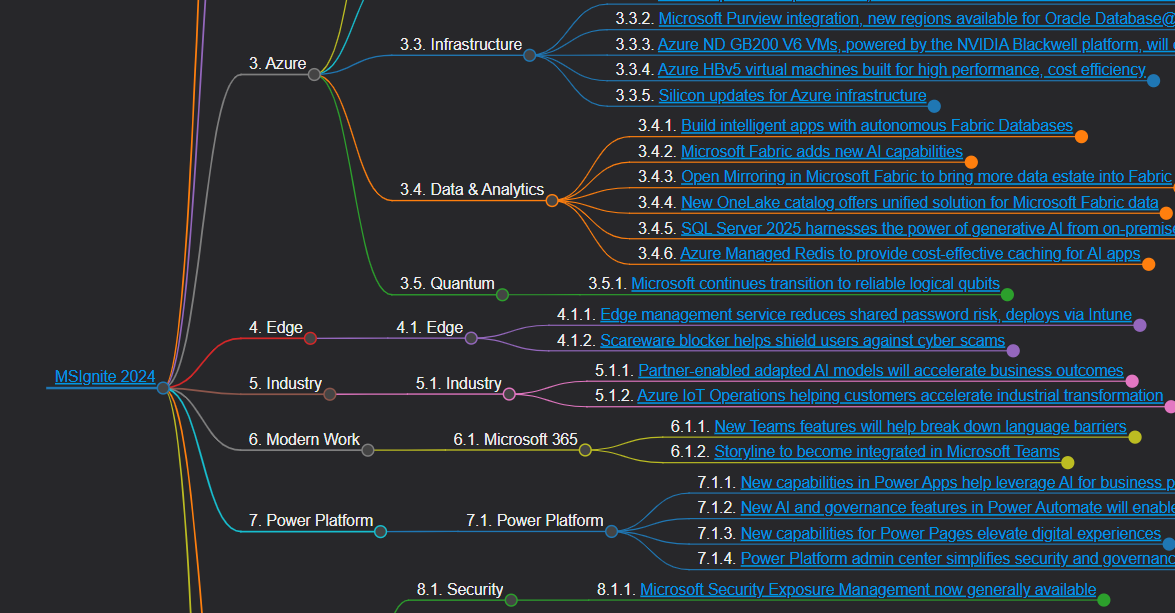
She grouped all Ignite sessions into groups and visualized them. I was so amazed with the concept that I knew I needed to find some time to play around with Markmap. My initial idea was (and still is) to make a similar visualization for all sessions at Directions EMEA, so I can have an easier time deciding what I’d like to listen to. I mean, it’s super hard to keep track of ~200 sessions otherwise…
I’ve started being more involved with Areopa within the past few months. Finding speakers, moderating webinars, and presenting my own topics, and as we were approaching this triple-digit number, I realized I have no clue about half the videos available on the channel. I was thinking about how could we make this huge collection of videos more discoverable. You can already see how this turned into a perfect opportunity to play with Markmap. Below you’ll find the result. I invite you to explore the graph, and if any video sparks your interest, go ahead and watch it! :P
But just before I let you go, I wanted to share a few “fun facts” that I found as I was handling the data of the videos:
- First video’s publish date: Jul 7, 2019
- Total number of unique speakers: 64
Top 5 most frequent presenters:
- Luc van Vugt – 13 webinars
- Tobias Fenster – 8 webinars
- Arend-Jan Kauffmann – 6 webinars
- waldo – 6 webinars
- Dmitry Katson – 5 webinars
Top 5 most watched webinars:
- Replicating Business Central data to Microsoft Dataverse (former CDS) (by Andrey Baludin)
- Working with files in Dynamics 365 Business Central SaaS (by Stefano Demiliani)
- Sync your Business Central data with Azure Data Lake (by Bert Verbeek)
- Working with XML in AL (by Arend-Jan Kauffmann)
- OAuth authentication with Business Central APIs (by Arend-Jan Kauffmann)
Most common topics:
- Test Automation: 16 videos
- AL: 12 videos
- DevOps: 12 videos
- Functional: 12 videos
- Power Platform: 7 videos
Interested in what’s under these topics? Well then I won’t keep you waiting any longer, here’s the visualization. You can zoom in and out, move the graph around, and click on the nodes to expand or collapse them. Click around, explore!